
Groundwater recharge in California (and everywhere) is dependent on climate, land surface processes, and subsurface conditions. The immediate source of recharge water is precipitation (rain and snow), from climate and atmospheric process, and derived from storm events. In California’s Mediterranean climate, characterized by wet winters and dry summers, maximum precipitation occurs in January. Water that reaches the surface then courses through variable land surface (e.g. runoff, infiltration, evaporation) and subsurface processes, with some fraction of it en route to recharging groundwater. It is because of these land surface and subsurface processes that maximum intra-annual recharge to California groundwater occurs in March, lagging precipitation by two months (FIGURE 1 below).
Because of the dependencies on land surface processes, the groundwater recharge response to precipitation is not linear. Pre-existing conditions of parameters such as soil moisture and near-surface humidity will influence the distribution and rates at which water that falls as precipitation courses through the variable land surface and subsurface processes. For example, during drought, soil moisture and near-surface humidity will likely be below saturation and will therefore be demanding of new rainfall, leaving less water available for recharge to groundwater. This explains why anomalous precipitation events during drought episodes do not necessarily yield anomalous groundwater recharge (e.g. FIGURE 2 below during 1987, 2001, 2007, 2014).
FIGURE 1. Seasonal Cycles of Precipitation and Groundwater Recharge in California
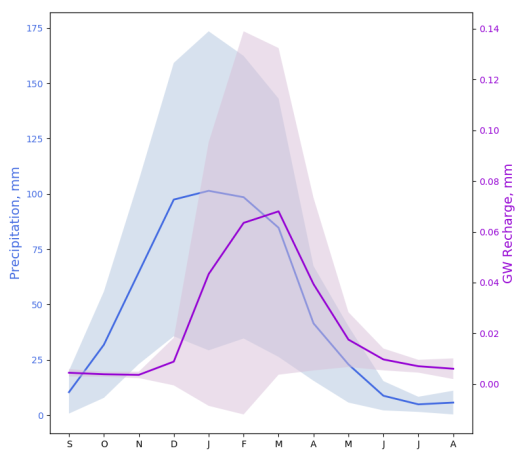
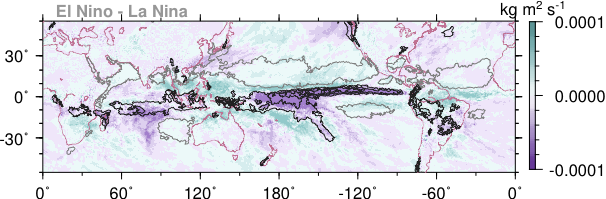
FIGURE 2. Time-series of Groundwater Recharge and Drought (Top) with Time-series of El Niño-Southern Oscillation and Precipitation (Bottom)
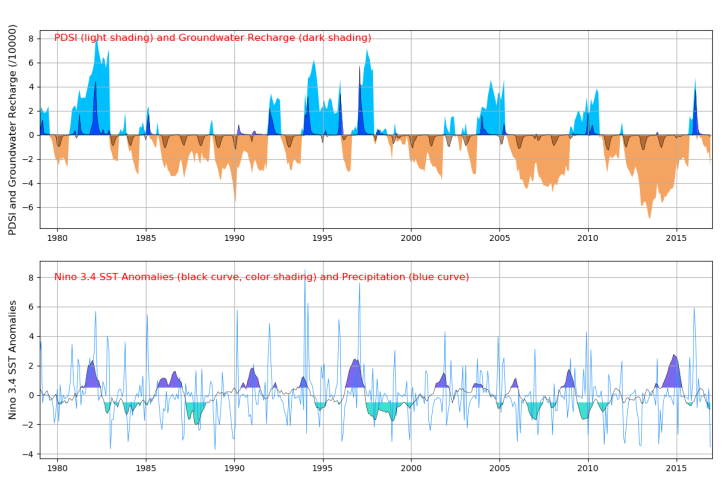
Bottom: Interannual variability of the El Nino sea surface temperature (SST) anomalies (Nino 3.4 SST, black curve and color shading) and California precipitation (blue curve).
 Monthly groundwater recharge climatology (1979-2017), calculated using NASA’s Western Land Data Assimilation System output. In this Mediterranean climate, the seasonal hydrologic cycle is characterized by winter precipitation and dry summers. More precipitation occurs to the north, along the coasts, and in the mountains (as snow) and the groundwater recharge is to a first order driven by this pattern. Spring snowmelt is transported as runoff by the network of rivers and streams into the valleys and lowlands to sustain groundwater recharge through spring and the dry summer. Coastal and northern precipitation resumes around October followed by winter precipitation across the region.
 VERSUS MID-SPRING 2019 (below)


